Bezier Curves
The path element features quite a number of these commands. There are two that are relevant for our purposes:
Q, which instructs the path to create a quadratic Bézier curve.C, which instructs the path to create a cubic Bézier curve.
Online practice site: https://bezier.method.ac
Intro to Bézier Curves
Bézier curves are surprisingly common. Due to their versatility, they're a staple in most graphics software like Photoshop or Figma, but they're also used as timing functions: if you've ever used non-linear CSS transitions (like the default "ease"), you've already worked with Bézier curves!
But what are they, and how do they work?
A Bézier curve is essentially a line from a start point to an end point that is acted upon by one or more control points. A control point curves the line towards it, as if the control point was pulling it in its direction.
The following line looks like a straight line, but check out what happens when you move the points around—try dragging the middle control point up and down.
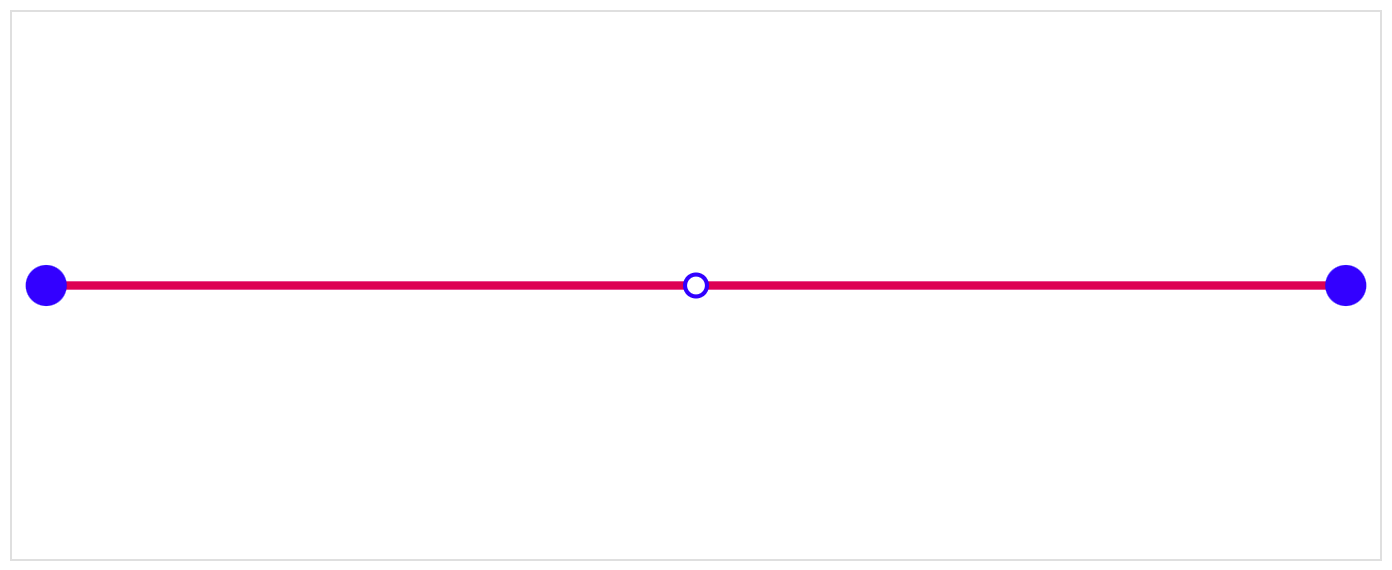
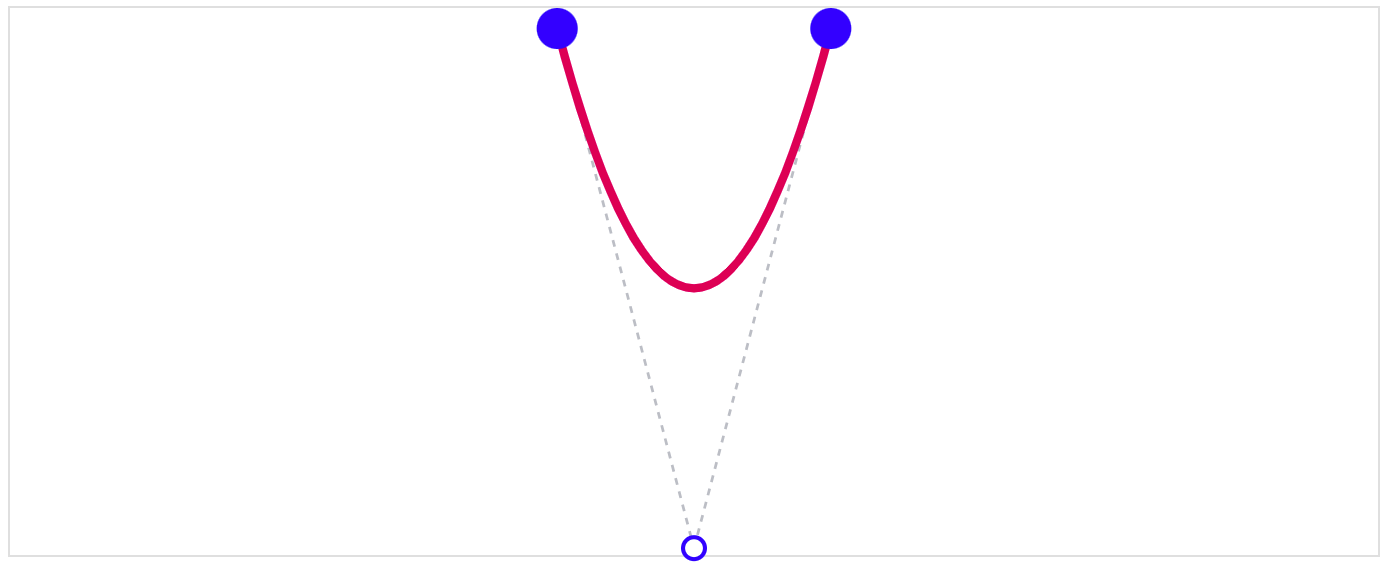
The line above is a quadratic Bézier curve; this means that it has a single control point. I'm guessing it gets its name from the fact that you can create parabola-like shapes with it:
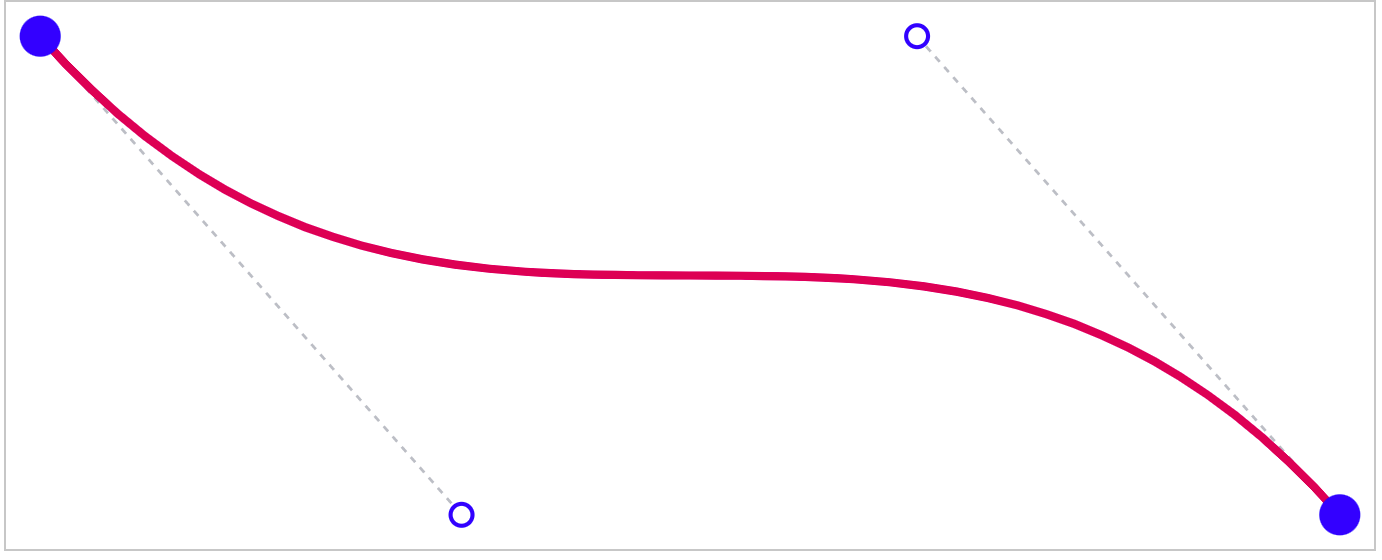
A cubic Bézier curve, in contrast, has two control points. This allows for much more interesting curves:
The syntax for Bézier curves in SVG path definitions is a little counter-intuitive, but it looks like this:
const startPoint = [25, 25];
const controlPoint = [300, 175];
const endPoint = [25, 325];
const path = (
  <path
    d={`
      M ${startPoint}
      Q ${controlPoint} ${endPoint}
    `}
    fill="none"
    stroke="hotpink"
    strokeWidth={5}
  />
)
render(
  <svg
    viewBox="0 0 200 350"
    style={{ maxHeight: 400 }}
  >
    {path}
  </svg>
);
The thing that makes this counter-intuitive, to me at least, is that the startPoint is inferred in the Q command; while there are 3 points needed for a quadratic Bézier curve, only 2 points are passed as arguments to Q.
Similarly, for a cubic Bézier curve, only the control points and the end point are provided to the C command.
This syntax does mean that curves can conveniently be chained together, as one curve starts where the last one ends:
const path = (
  <path
    d={`
      M 25,25
      C 100,50 25,75 25,100
      C 25,125 300,150 25,175
    `}
    fill="none"
    stroke="hotpink"
    strokeWidth={5}
  />
)
render(
  <svg
    viewBox="0 0 200 200"
    style={{ maxHeight: 400 }}
  >
    {path}
  </svg>
);
OK, I think that's enough playing with vanilla SVGs. Let's see how we can leverage React to make these curves dynamic!
Bézier Curves in React
Up to this point, we've been looking at static SVGs. How do we make them change, over time or based on user input?
Well, in keeping with the "meta" theme of this blog post, why not examine the draggable-with-lines Bézier curves from earlier in this post?
There's a fair bit of code to manage this, even in this slightly-simplified snippet. I've annotated it heavily, which hopefully makes things easier to parse.
class Bezier extends React.PureComponent {
  constructor(props) {
    super(props);

    this.state = {
      // These are our 3 Bézier points, stored in state.
      startPoint: { x: 10, y: 10 },
      controlPoint: { x: 190, y: 100 },
      endPoint: { x: 10, y: 190 },

      // We keep track of which point is currently being
      // dragged. By default, no point is.
      draggingPointId: null,
    };
  }

  handleMouseDown(pointId) {
    this.setState({ draggingPointId: pointId });
  }

  handleMouseUp() {
    this.setState({ draggingPointId: null });
  }

  handleMouseMove({ clientX, clientY }) {
    const { viewBoxWidth, viewBoxHeight } = this.props;
    const { draggingPointId } = this.state;

    // If we're not currently dragging a point, this is
    // a no-op. Nothing needs to be done.
    if (!draggingPointId) {
      return;
    }

    // During render, we capture a reference to the SVG
    // we're drawing, and store it on the instance with
    // `this.node`.
    // If we were to `console.log(this.node)`, we'd see a
    // reference to the underlying HTML element.
    // eg. `<svg viewBox="0 0 250 250"
    const svgRect = this.node.getBoundingClientRect();

    /*
    Ok, this next bit requires some explanation.

    The SVG rect gives us the element's position relative
    to the viewport.

    The user's mouse position with `clientX` and `clientY`
    is also relative to the viewport.

    What we actually care about, though, is the cursor's
    position relative to the SVG itself.

    Let's use a diagram! Imagine if ⬁ is the user's cursor:


    ------------------------------------------------------
    | viewport            ______________                 |
    |                    |              |                |
    |                    |       ⬁      | <- SVG         |
    |                    |______________|                |
    |____________________________________________________|

    ^----------------------------^ This is the `clientX`;
                                   the distance between the
                                   viewport and the cursor.

    ^-------------------^          This is the `svgRect`
                                   `left` value. Distance
                                   between the viewport and
                                   the SVG's left edge.

                        ^--------^ This is the distance we
                                   care about; the distance
                                   between the SVG's left
                                   edge, and the cursor.

    We can get that value with subtraction!
    */
    const svgX = clientX - svgRect.left;
    const svgY = clientY - svgRect.top;

    /*
    The next problem is that our SVG has a different
    coordinate system: Our SVG's `viewBox` might be 250x250,
    while in terms of the screen real-estate it might
    actually take up 500x500 pixels!

    To solve for this, I used cross-multiplication. Here are
    the variables we need:

    - svgX            The value we just calculated. The
                      cursor's `x` position within the SVG.

    - viewBoxWidth    The width of the SVG's internal
                      coordinate system. Specified via
                      props to this component.

    - svgRect.width   The on-screen width of the DOM element
                      Returned from `getBoundingClientRect`.

    Armed with that data, we can cross-multiply as follows:

         svgX               viewBoxX (unknown)
    --------------    =    --------------------
     viewBoxWidth             svgRect.width

    The left side of this equation is in terms of the screen
    real-estate: our cursor might be 250px into a 500px-wide
    svg.

    The right side is the SVG's viewBox coordinate system.
    We're `X` pixels into a 250px-wide viewBox.

    When we re-arrange the formula to solve for `viewBoxX`,
    we wind up with:
    */
    const viewBoxX = svgX * viewBoxWidth / svgRect.width;

    // We do the same thing for the vertical direction:
    const viewBoxY = svgY * viewBoxHeight / svgRect.height;

    // Phew! That was a lot of stuff, but in the end we
    // wind up with the user's mouse position within the
    // SVG's viewBox, and can update React state so that it
    // re-renders in this new position!
    this.setState({
      [draggingPointId]: { x: viewBoxX, y: viewBoxY },
    });
  }

  render() {
    const { viewBoxWidth, viewBoxHeight } = this.props;
    const {
      startPoint,
      controlPoint,
      endPoint,
    } = this.state;

    // As we've seen before, the quadratic Bézier curve
    // involves moving to the starting point, and then
    // specifying the control and end points with `Q`
    const instructions = `
      M ${startPoint.x},${startPoint.y}
      Q ${controlPoint.x},${controlPoint.y}
        ${endPoint.x},${endPoint.y}
    `;

    // While the Bézier curve is the main attraction,
    // we also have several shapes, including:
    //   - the handles for the start/control/end points
    //   - the dashed line that shows how the control
    //     point connects to the start/end points.
    return (
      <svg
        ref={node => (this.node = node)}
        viewBox={`0 0 ${viewBoxWidth} ${viewBoxHeight}`}
        onMouseMove={ev => this.handleMouseMove(ev)}
        onMouseUp={() => this.handleMouseUp()}
        onMouseLeave={() => this.handleMouseUp()}
        style={{ width: '100%', overflow: 'visible' }}
      >
        <ConnectingLine
          from={startPoint}
          to={controlPoint}
        />
        <ConnectingLine from={controlPoint} to={endPoint} />

        <Curve instructions={instructions} />

        <LargeHandle
          coordinates={startPoint}
          onMouseDown={() =>
            this.handleMouseDown('startPoint')
          }
        />

        <LargeHandle
          coordinates={endPoint}
          onMouseDown={() =>
            this.handleMouseDown('endPoint')
          }
        />

        <SmallHandle
          coordinates={controlPoint}
          onMouseDown={() =>
            this.handleMouseDown('controlPoint')
          }
        />
      </svg>
    );
  }
}

// These helper stateless-functional-components allow us
// to reuse styles, and give each shape a meaningful name.

const ConnectingLine = ({ from, to }) => (
  <line
    x1={from.x}
    y1={from.y}
    x2={to.x}
    y2={to.y}
    stroke="rgb(200, 200, 200)"
    strokeDasharray="5,5"
    strokeWidth={2}
  />
);

const Curve = ({ instructions }) => (
  <path
    d={instructions}
    fill="none"
    stroke="rgb(213, 0, 249)"
    strokeWidth={5}
  />
);

const LargeHandle = ({ coordinates, onMouseDown }) => (
  <ellipse
    cx={coordinates.x}
    cy={coordinates.y}
    rx={15}
    ry={15}
    fill="rgb(244, 0, 137)"
    onMouseDown={onMouseDown}
    style={{ cursor: '-webkit-grab' }}
  />
);

const SmallHandle = ({ coordinates, onMouseDown }) => (
  <ellipse
    cx={coordinates.x}
    cy={coordinates.y}
    rx={8}
    ry={8}
    fill="rgb(255, 255, 255)"
    stroke="rgb(244, 0, 137)"
    strokeWidth={2}
    onMouseDown={onMouseDown}
    style={{ cursor: '-webkit-grab' }}
  />
);

render(<Bezier viewBoxWidth={250} viewBoxHeight={250} />);
The full version, with support for touch events, can be found on GitHub.
To summarize how this works:
- React holds variables in component state for
startPoint,controlPoint, andendPoint. - In the
rendermethod, we build the instructions for thepathusing these state variables. - When the user clicks or taps on one of the points, we update the state to keep track of which point is moving with
draggingPointId. - As the user moves the mouse (or finger) across the SVG's surface, we do some calculations to figure out where the currently-dragging point needs to move to. This is made complex by the fact that SVGs have their own internal coordinate system (
viewBox), and so we have to translate the on-screen pixels to this system. - Once we have the new X/Y coordinate for the active point,
setStatelets React know about this state change, and the component re-renders, which causes thepathto be re-calculated.